This blog explains how to make Elevation-Volume-Area Curve using Surface Volume Tool in ARCGIS. The curve is useful for making decision in Hydropower project and to design different components along with determining release policy, etc.
Refer Video tutorial here. The link to download the pdf is given at the bottom.
How to write address in python?
Python uses ‘\’ as escape character so it
cannot be used in path. Either use ‘/’ or ‘\\’ but if you wish to use ‘\’ in
path then put ‘r’ in front of path. Following example illustrates these-
Method 1:
'E:\\HYDROLOGY\\S2\\ArcPY\\OUTPUT'
Method 2:
'E:/HYDROLOGY/S2/ArcPY/OUTPUT'
Method 3:
r'E:\HYDROLOGY\S2\ArcPY\OUTPUT'
r REPRESENTS raw data.
What is ArcPy ?
ArcPy is a python site package. It is used in
python to perform data analysis, data management, ect. Hence, ArcPy helps to
perform the task of GIS in Python.
In Arc Gis version 10, python version used is
2.6, which is installed with ArcGis.
All you need to do is import ArcPy in python
editor and start coding.
How to use Surface
Volume tool to find Elevation-Area-Volume Curve?
Requirement:
·
Enable 3D
Anlayst as-
Customize |
Extension | Check on 3D Analyst
·
GeoPrecessing
| Geoprocessing Option…|Check on ‘Overwrite the outputs of geoprocessing
operations’
Ø This will append the output data of surface
volume to the existing text file.
Ø If this option is not ticked/checked on then
error occurs if you try to store multiple data to the same text file.
Steps:
1. Import
DEM of the catchment, in ArcGis, you want to find the curve for
2. Open
Python Console and write Code
3. For
single data (area-volume for one elevation only)
>>>from
arcpy import *
* indicates è import
everything from arcpy.
Now, Set output file location….
>>>Output = r'E:\AY\S\S2\ArcPY\SurfaceVolume\Volume.txt'
>>>arcpy.SurfaceVolume_3d('cat_dem.tif',Output,"BELOW",1600)
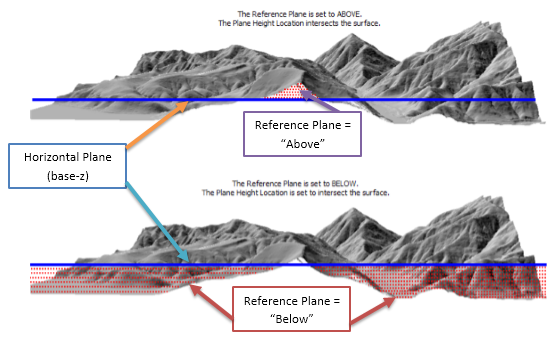
Parameters of Surface Volume Tool-
SN
|
Parameter
|
Explanation
|
1
|
In_rastersurface
|
DEM or TIN
|
2
|
Out_text_file
|
Output file location
|
3
|
Reference_plane
|
Specify “Above” or “Below” to calculate area/volume above or below the
horizontal plane
|
4
|
Base_z = elevation to calculate
|
The horizontal plane above or below which area/volume is calculated
|
Note: While giving elevation input (base-z), it should be
between maximum and minimum elevation value of DEM.
Fig. Figure showing Reference plane and base-z
(Image Source: Arcgis Website)
4. For Multiple data
Use for loop
Syntax: for i
in range (start, stop, step):
{Write code here}
Note: Here, replace the elevation data of step
3 with “i” to calculate for multiple elevations
Lets create for
200 m interval from 1800 to 3600
>>> for i in range(1800,3600,200):
...
arcpy.SurfaceVolume_3d('cat_dem.tif',Output,"BELOW",i)
(Here i represents the elevation. Area/Volume is found from elevation of
1800 up to 3400 with 200 interval i.e. 1800, 2000, 2200, 2400, …, 3400)
Why stop=3600 but data is calculated up to
3400 only ??
Note: In python
stop value is excluded i.e. 3600 will not be calculated. If you want to
calculate for 3600 then use stop value of greater than 3600 like any one of the
value as - 3601, 3652, 3700, 3800, etc. (all are greater than 3600 so you can
use any of them)
5. Plot the
data in excel or other software…
Final Code:
>>> from
arcpy import *
>>>arcpy.SurfaceVolume_3d('cat_dem.tif',r'E:\AY\S\S2\ArcPY\SurfaceVolume\Volume.txt',"BELOW",1600)
<Result
'E:\\AY\\S\\S2\\ArcPY\\SurfaceVolume\\Volume.txt'>
>>>
for i
in
range(1800,3600,200):
...
arcpy.SurfaceVolume_3d('cat_dem.tif',r'E:\AY\S\S2\ArcPY\SurfaceVolume\Volume.txt',"BELOW",i)
Output:
Dataset,
Plane_Height, Reference, Z_Factor, Area_2D, Area_3D, Volume
..rcPY\SurfaceVolume\cat_dem.tif,
1800.00, BELOW, 1.000000, 2386036360.9595, 2737722134.2743, 1292870451541.2
..rcPY\SurfaceVolume\cat_dem.tif,
2000.00, BELOW, 1.000000, 2751422471.6363, 3163428393.3652, 1808497318967.5
..rcPY\SurfaceVolume\cat_dem.tif,
2200.00, BELOW, 1.000000, 3028033578.3525, 3487425353.1481, 2387809023310
..rcPY\SurfaceVolume\cat_dem.tif,
2400.00, BELOW, 1.000000, 3229310550.9426, 3724084680.6395, 3014856120712.8
..rcPY\SurfaceVolume\cat_dem.tif,
2600.00, BELOW, 1.000000, 3367325890.0696, 3886617696.2116, 3675457721085.6
..rcPY\SurfaceVolume\cat_dem.tif,
2800.00, BELOW, 1.000000, 3453274628.7979, 3987641478.238, 4358511131963.1
..rcPY\SurfaceVolume\cat_dem.tif,
3000.00, BELOW, 1.000000, 3504734282.3825, 4048058015.2732, 5054687151193.3
..rcPY\SurfaceVolume\cat_dem.tif,
3200.00, BELOW, 1.000000, 3541936569.2609, 4091009563.4753, 5759568714963.8
..rcPY\SurfaceVolume\cat_dem.tif,
3400.00, BELOW, 1.000000, 3563171917.2772, 4115247120.6426, 6470475092432.7
Area2D = Projected Area
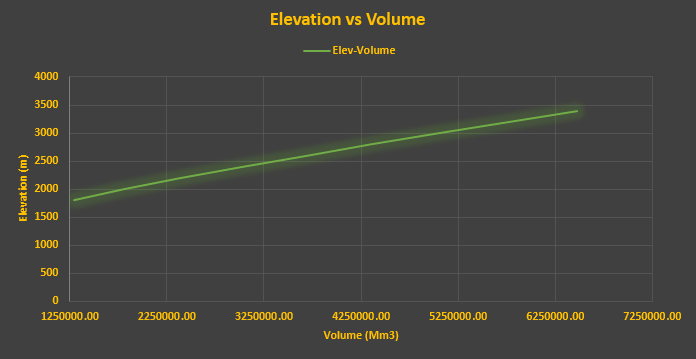
Elevation vs Volume curve
Area2D = Projected Area
Area3D = Surface Area
Elevation vs Area curveElevation vs Volume curve


No comments:
Post a Comment